Exploring the Poverty Cycle in Delaware County, OH
|
This study was done as a final project in GIS Software I at Columbus State Community College. I was assigned to study three variables affecting poverty in Delaware County, Ohio. I chose to study the correlation of education level and poverty, recipients of SNAP (Supplemental Nutritional Assistance Program, commonly known as Food Stamps), and the report cards issued by the State of Ohio to public schools.
|

|
School Ratings and Child Poverty
In an effort to improve quality of education received by students in Ohio’s public schools, the state of Ohio issues school report cards on a yearly basis. Schools are rated as “Excellent With Distinction” (A+), “Excellent” (A), “Effective” (B), “Continuous Improvement” (C), “Academic Watch” (D), and “Academic Emergency” (F). I was interested to see if there was a correlation in Delaware County between areas with higher concentrations of children under 18 living in poverty and poor performance on school report cards.
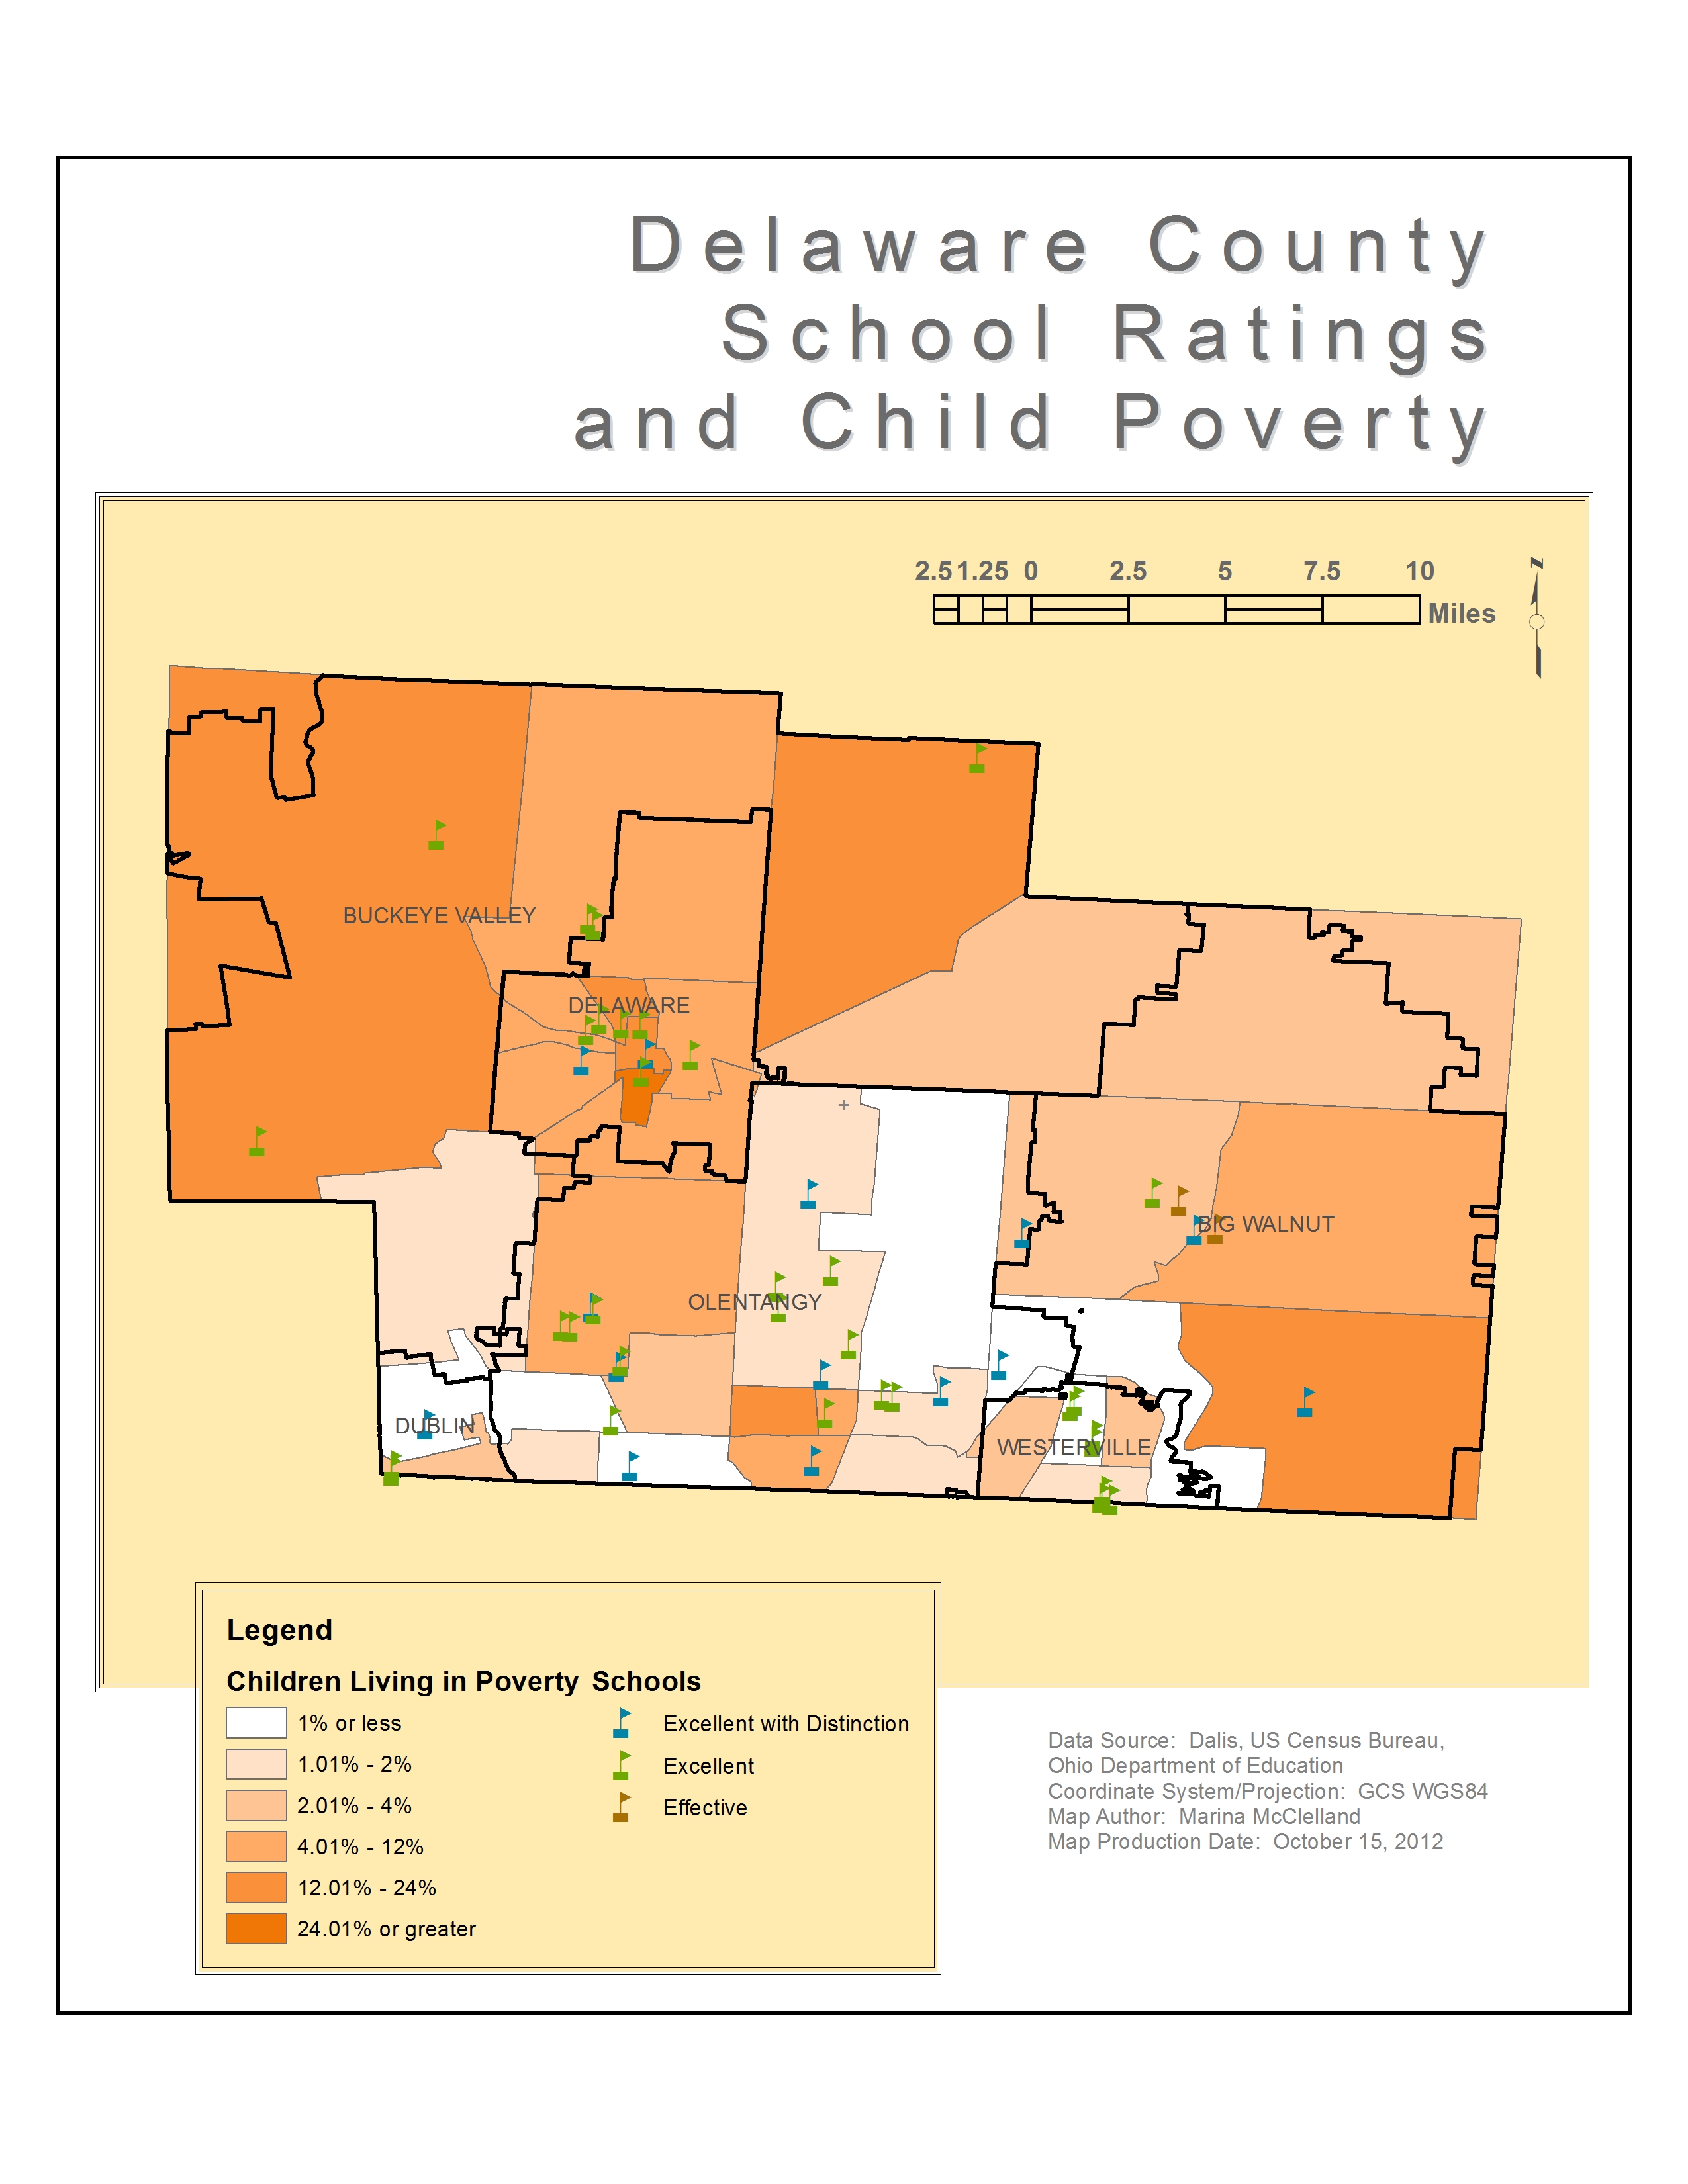
Chloropleth map showing the percentage of children living in poverty in each census tract, plus outlines of the school district map, and location of schools which are color coded according to ratings received by the State of Ohio. Schools shown in blue received an “Excellent with Distinction” rating, those shown in green received “Excellent”, and the yellow schools received an “Effective” rating.
Median Income and SNAP
Food insecurity is also factor in poor school performance. It is defined as “a household-level economic and social condition of limited or uncertain access to adequate food.” by the USDA. Children from food insecure families have more problems paying attention in school than their peers. This is why programs such as SNAP and the free school lunch program are essential in helping to end the poverty cycle through education.

Chloropleth map showing the median income for each census tract, and a dot density map showing SNAP status of households.
Poverty and Education Level
Education level and poverty go hand and hand. Not only does a higher level of education affect earning potential, but research has shown that students from low income families tend to perform more poorly in school. Those students who are performing poorly tend not to go to college (both grades and an inability to pay for to tuition are factors in this) thus decreasing their earning potential and more often than not, raising their children in poverty, as well.

Chloropleth map showing the percentage of the population over the age of 25 that had 4 or more years of college, and graduated dots showing the percentage of the population living in poverty.
